
Tutorials
- miEAA web server tutorial
- Browsable Web API Tutorial
- Command Line Interface and Python/R API Documentation
MiEAA tutorial
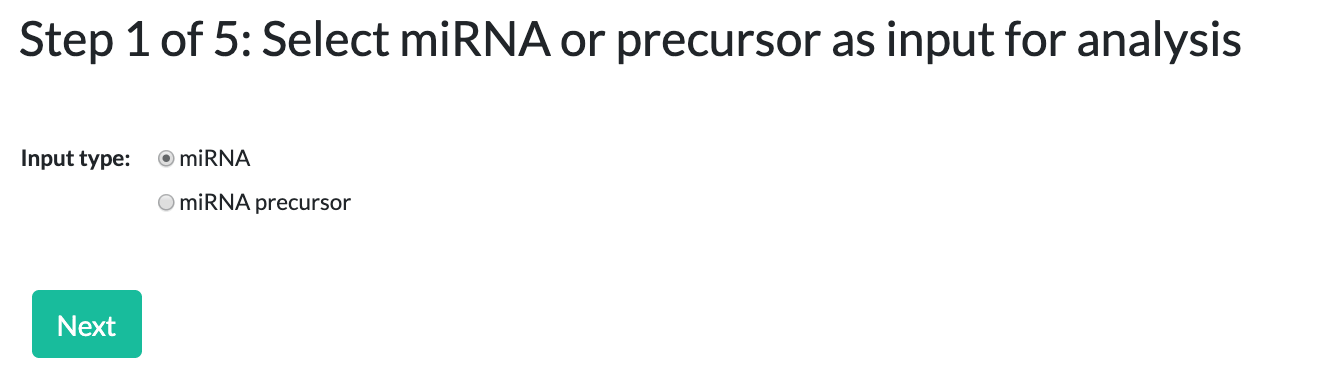
Step 1: Type of miRNA set
In this step, select the type of miRNA set you have.
MiEAA provides the option for precursors, e.g. "hsa-mir-1-1", and mature miRNAs, e.g. "hsa-miR-1-5p".
MiEAA uses version 22 of miRBase for miRNA IDs.
If you have an older version of miRNA IDs, you can convert it using our "miRBase converter", available in the navigation bar.
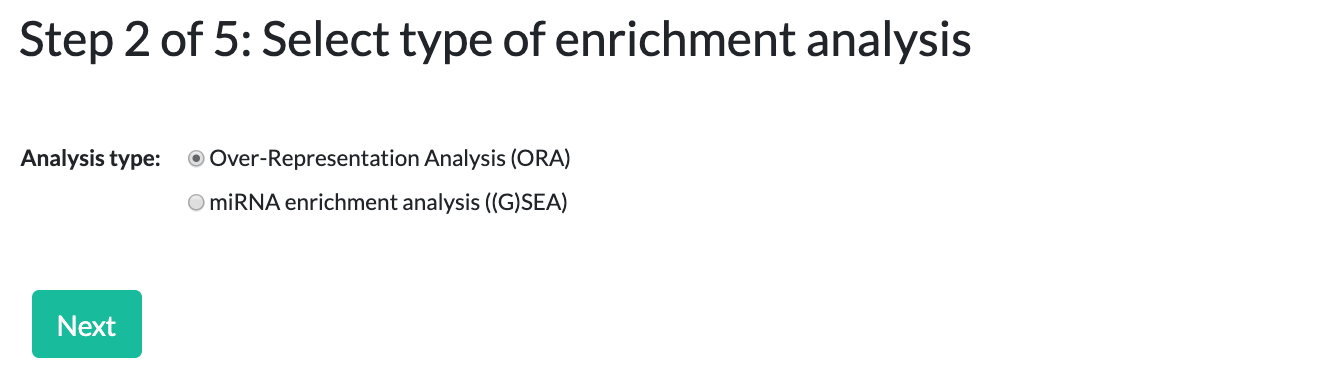
Step 2: Type of analysis
MiEAA provides two different analysis methods:
over-representation analysis (ORA) and miRNA (gene) set enrichment analysis (GSEA).
For GSEA, your input list should be sorted by an arbitrary criterion, e.g. miRNA expression or something similar.
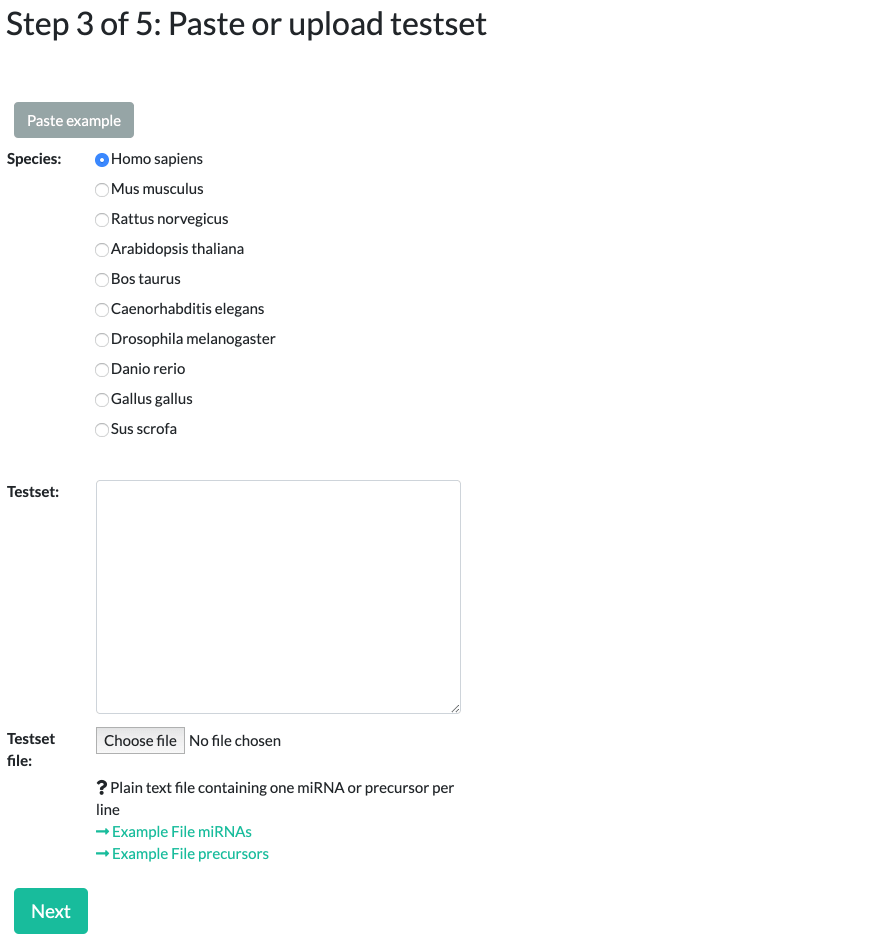
Step 3: Species selection and specifying a test set
Select which species to run the analysis for. You can select between 10 different options, the most prevalent being Homo sapiens (Human), Mus musculus (Mouse), and Rattus norvegicus (Rat).
Please note that miRNAs/precursors names should match the selected species, beginning with "hsa", "mmu", "rno", etc.
When specifying the test set, uploaded data should be a text file consisting of miRNA IDs in a simple newline separated list. For examples see
Example testset (miRNAs)
or
Example testset (precursors).
The list should consist entirely of either miRNAs or precursors for the selected species.
Alternatively, you can simply paste your miRNA/precursor list into the text field.
Entries must match the the species name, miRNA/precursor type, and exist in miRBase version 22.
Any names that do not meet this criteria will cause a warning message to appear when moving to next step.
These invalid entries must be corrected or removed before proceeding.
To see example input, please click on the "Paste example" button.
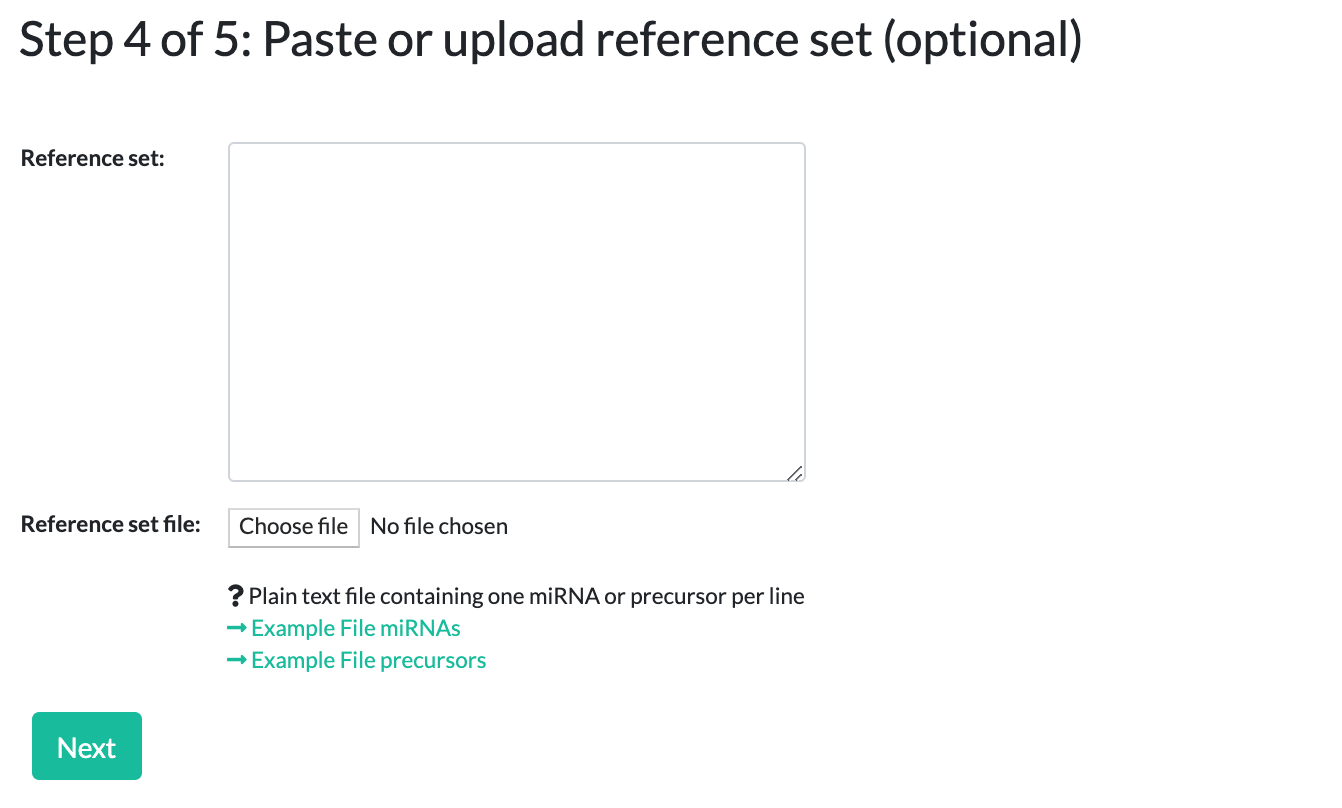
Step 4: Adding a reference set (optional)
This step is only for ORA. Here you can define an optional reference set, or simply click "Next" to skip this step.
For example, if you performed a microarray experiment from which you selected your miRNAs for the testset, it makes sense to provide all miRNAs that are spotted on the array as a reference/background set.
If you do not upload a reference set, the tool will use its own reference sets, consisting of all the annotated miRNAs from the selected categories.
Similar to the testset, you can choose to upload a reference file or simply paste your data.
The same caveats from the testset input also apply to the reference set - names must match the selected species, miRNA/precursor type, exist in miRBase version 22, and be in a simple list format.
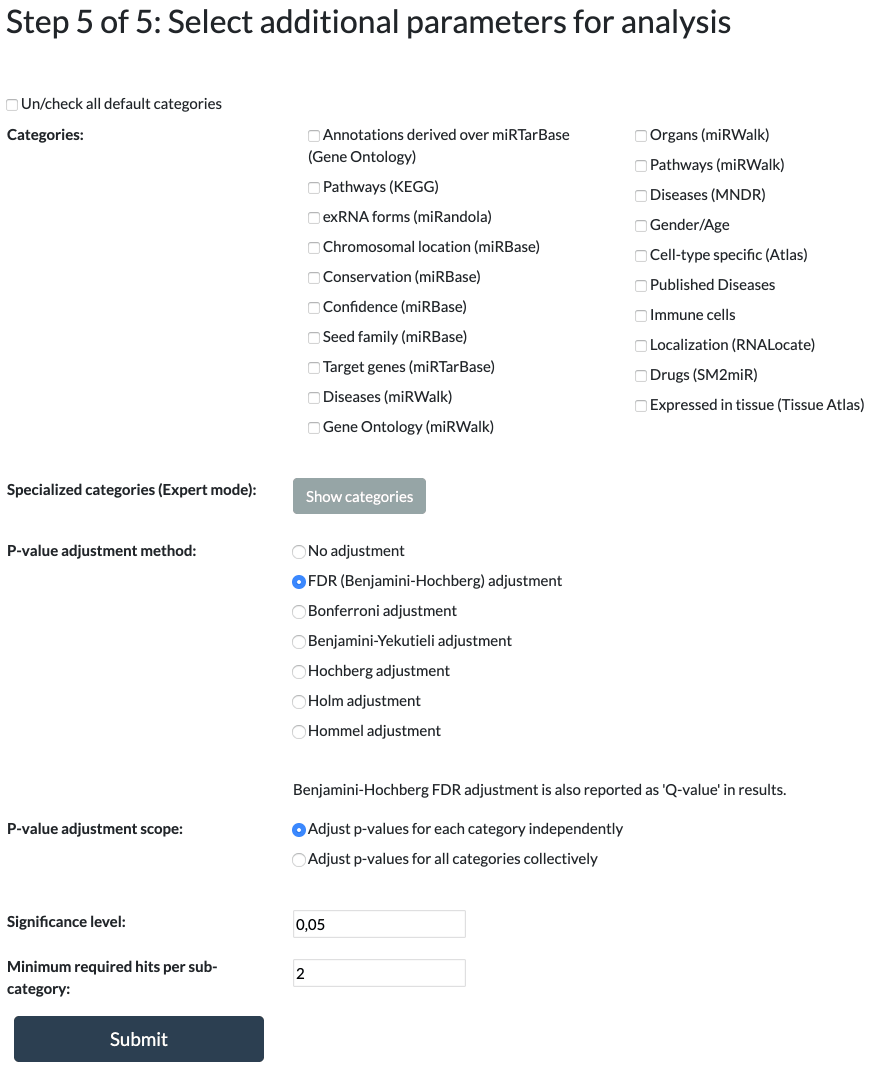
Step 5: Additional Parameters
MiEAA has multiple predefined categories selected from numerous databases and publications.
Precursors and mature miRNAs have different categories available to them.
At least one category must be selected in order to proceed.
The following p-value adjustments are available:
FDR (Benjamini-Hochberg), Bonferroni, Benjamini-Yekutieli, Hochberg, Holm, Hommel, or No Adjustment.
Regardless of the selected adjustment, q-values will always be present in the results, alongside both the raw and adjusted p-values.
Default is FDR (Benjamini-Hochberg) adjustment.
The p-value adjustment scope allows you to control the level at which the p-values are adjusted.
Categories can either be treated as independent from each other, adjusting over each one separately, or
p-values can be adjusted over all selected categories collectively.
Default is adjusting category p-values independently.
All adjusted p-values greater than or equal to the significance level will be omitted from the results.
The significance level can be any value between 0 and 1.
Default is 0.05.
The threshold value is for filtering the output to show only subcategories that contain at least this many miRNAs/precursors.
It can be any integer greater than or equal to 1.
Default is 2.
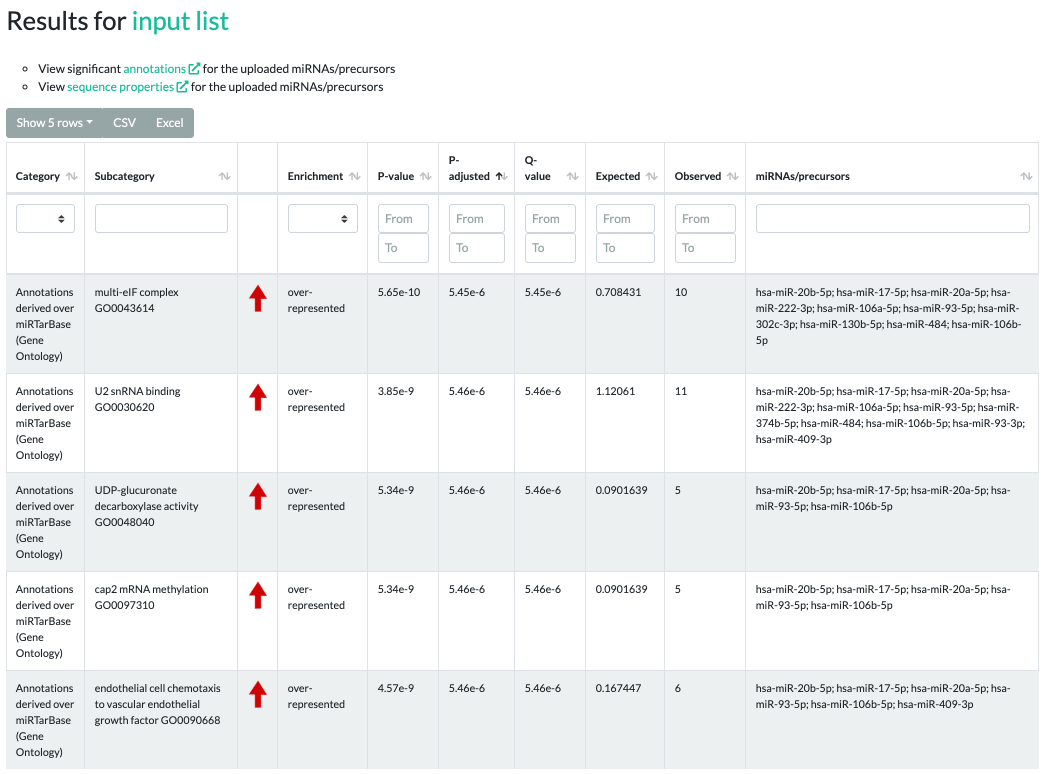
Results for ORA
The ORA results contain significant categories, subcategories, raw p-values, adjusted p-values, q-values,
type of enrichment, expected counts, observed counts, and miRNAs/precursors of the testset contained in the subcategory.
The enrichment values can be either "over-represented" or "under-represented" and are visualized by red or green arrows, respectively.
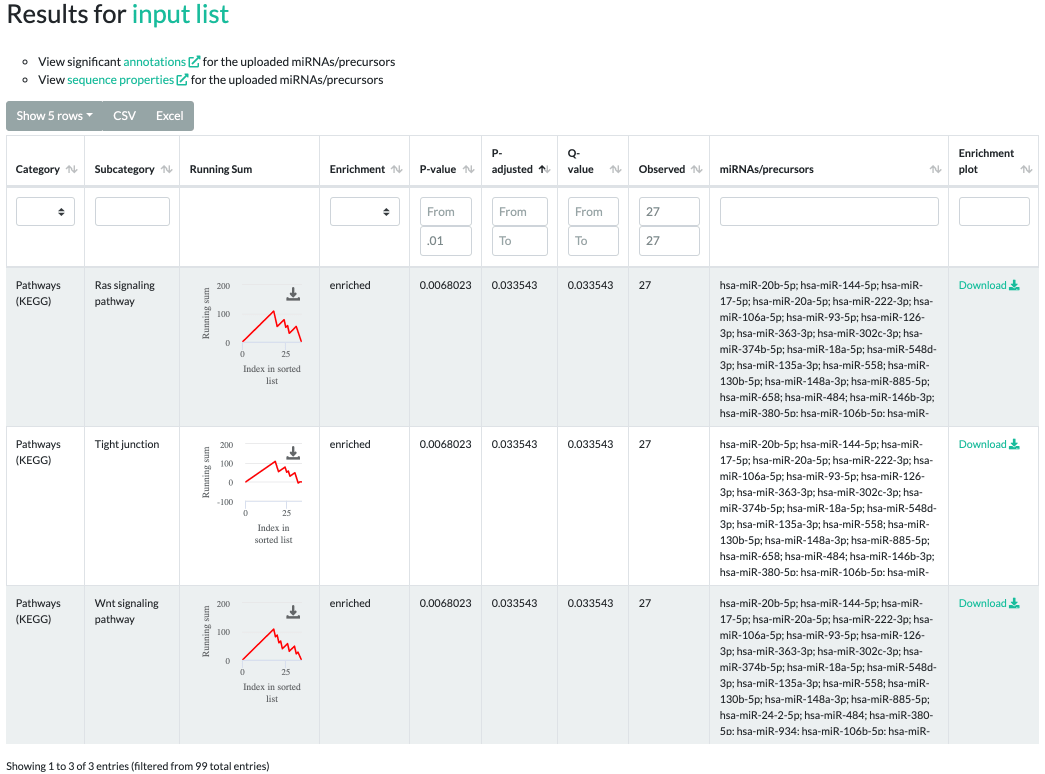
Results for GSEA
The GSEA results contain significant categories, subcategories, a downloadable running sum image,
raw p-values, adjusted p-values, q-values, type of enrichment, observed counts,
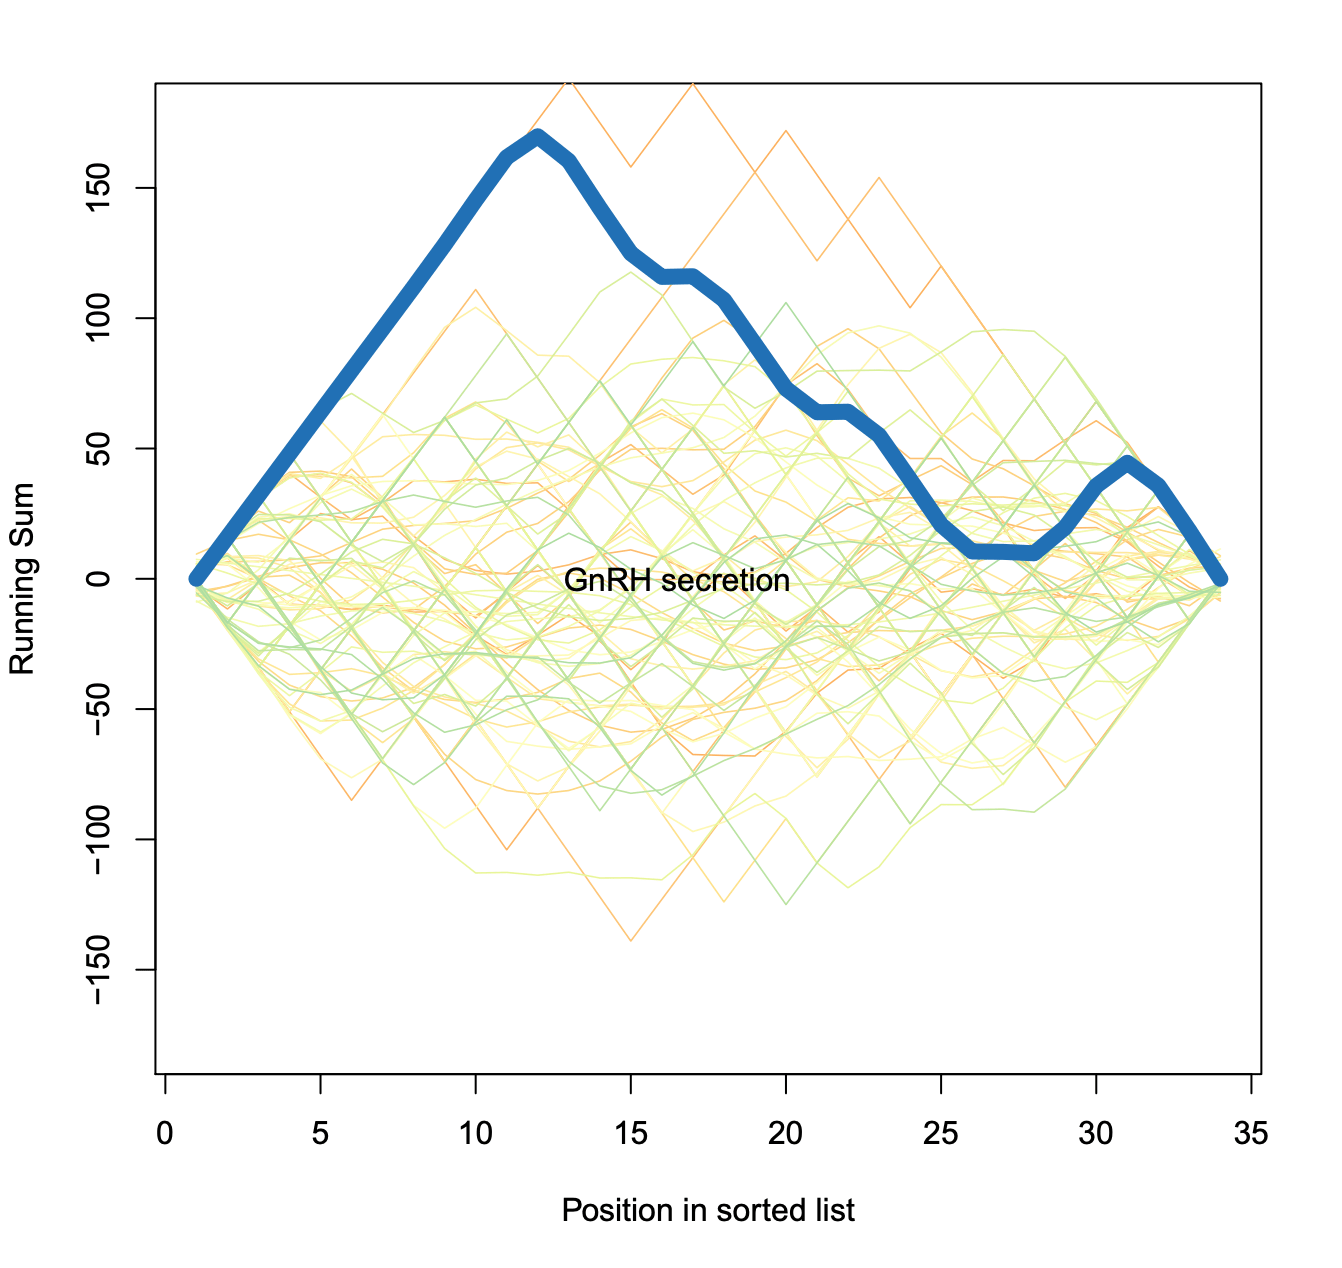
miRNAs/precursors of the testset contained in the subcategory and exportable, more sophisticated enrichment plots.
In the interactive inline plot, a running sum is colored red or green depending on whether the subcategory was "enriched" or "depleted", respectively.
Exported enrichment plot:
Results for all analyses
ORA and GSEA result output can be sorted and filtered on each criterion.
The "Category" and "Enrichment" columns provide a user friendly drop-down menu.
Multiple filters on separate criteria can be simultaneously applied.
All results can be downloaded as an Excel sheet or Comma-Separated Values.
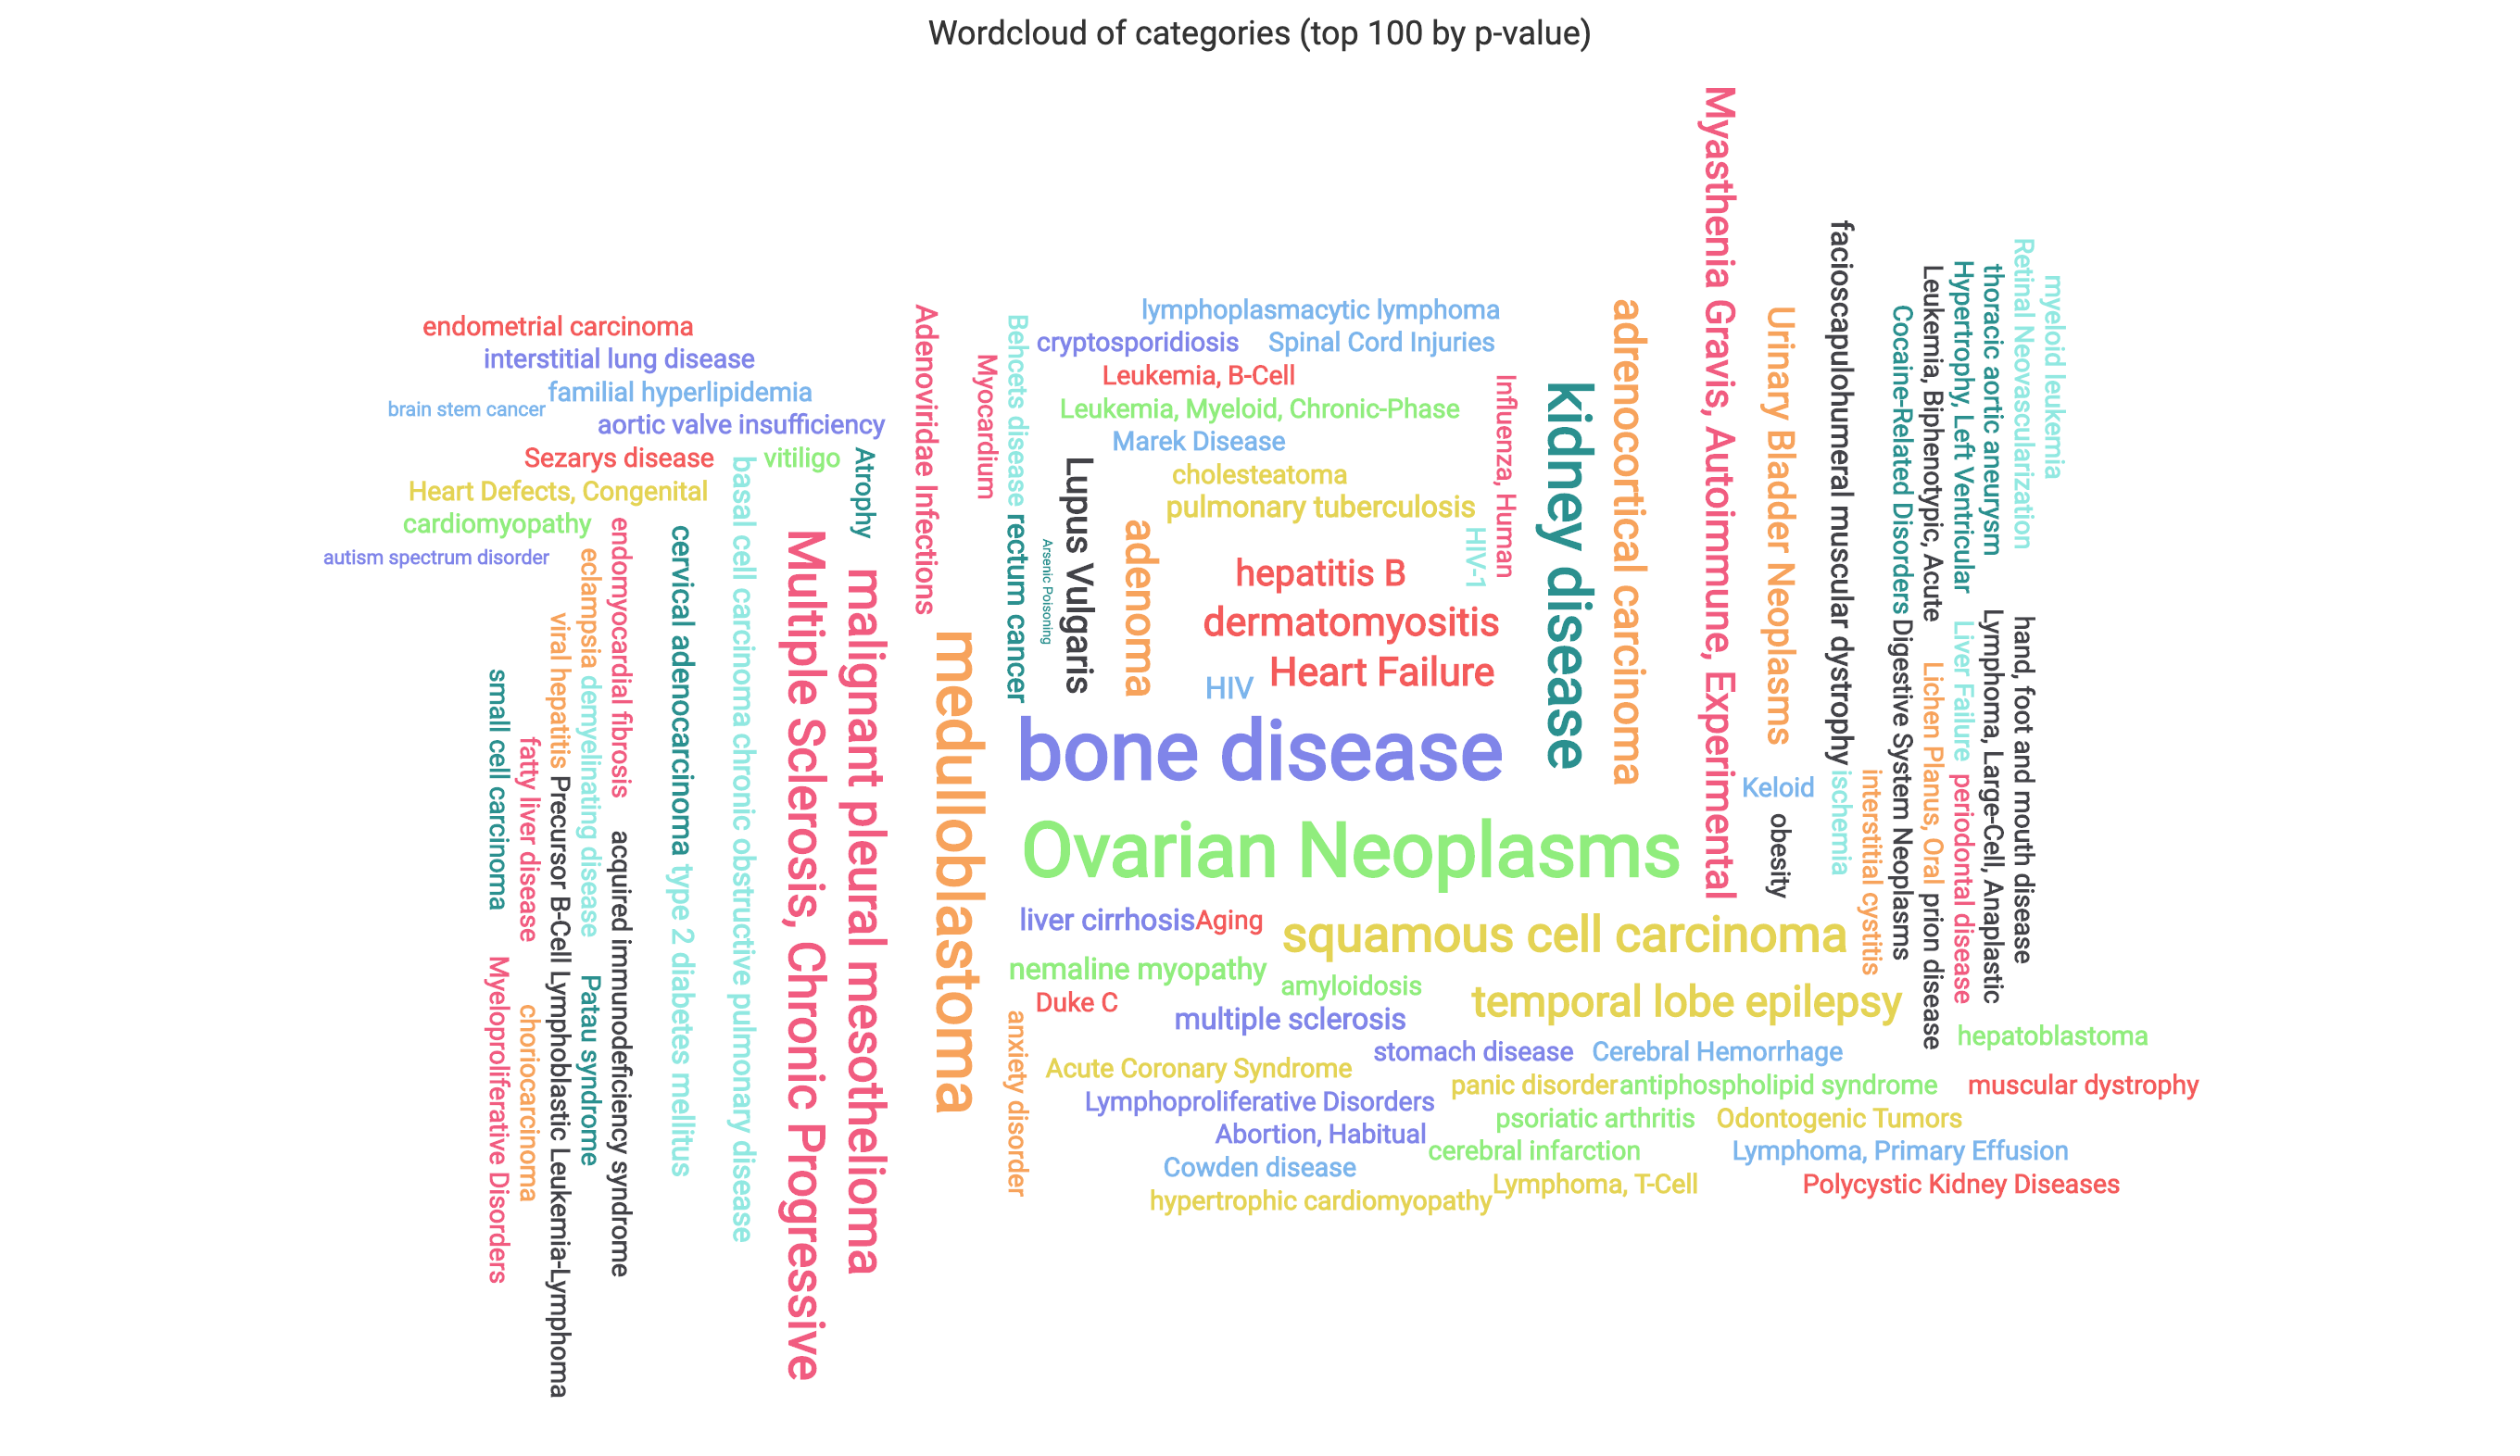
Several plots are generated to represent the enriched subcategories.
The wordcloud displays the 100 most signifcant subcategories, with sizes reflecting the observed counts of each.
The scaling can be adjusted using the provided drop-down.
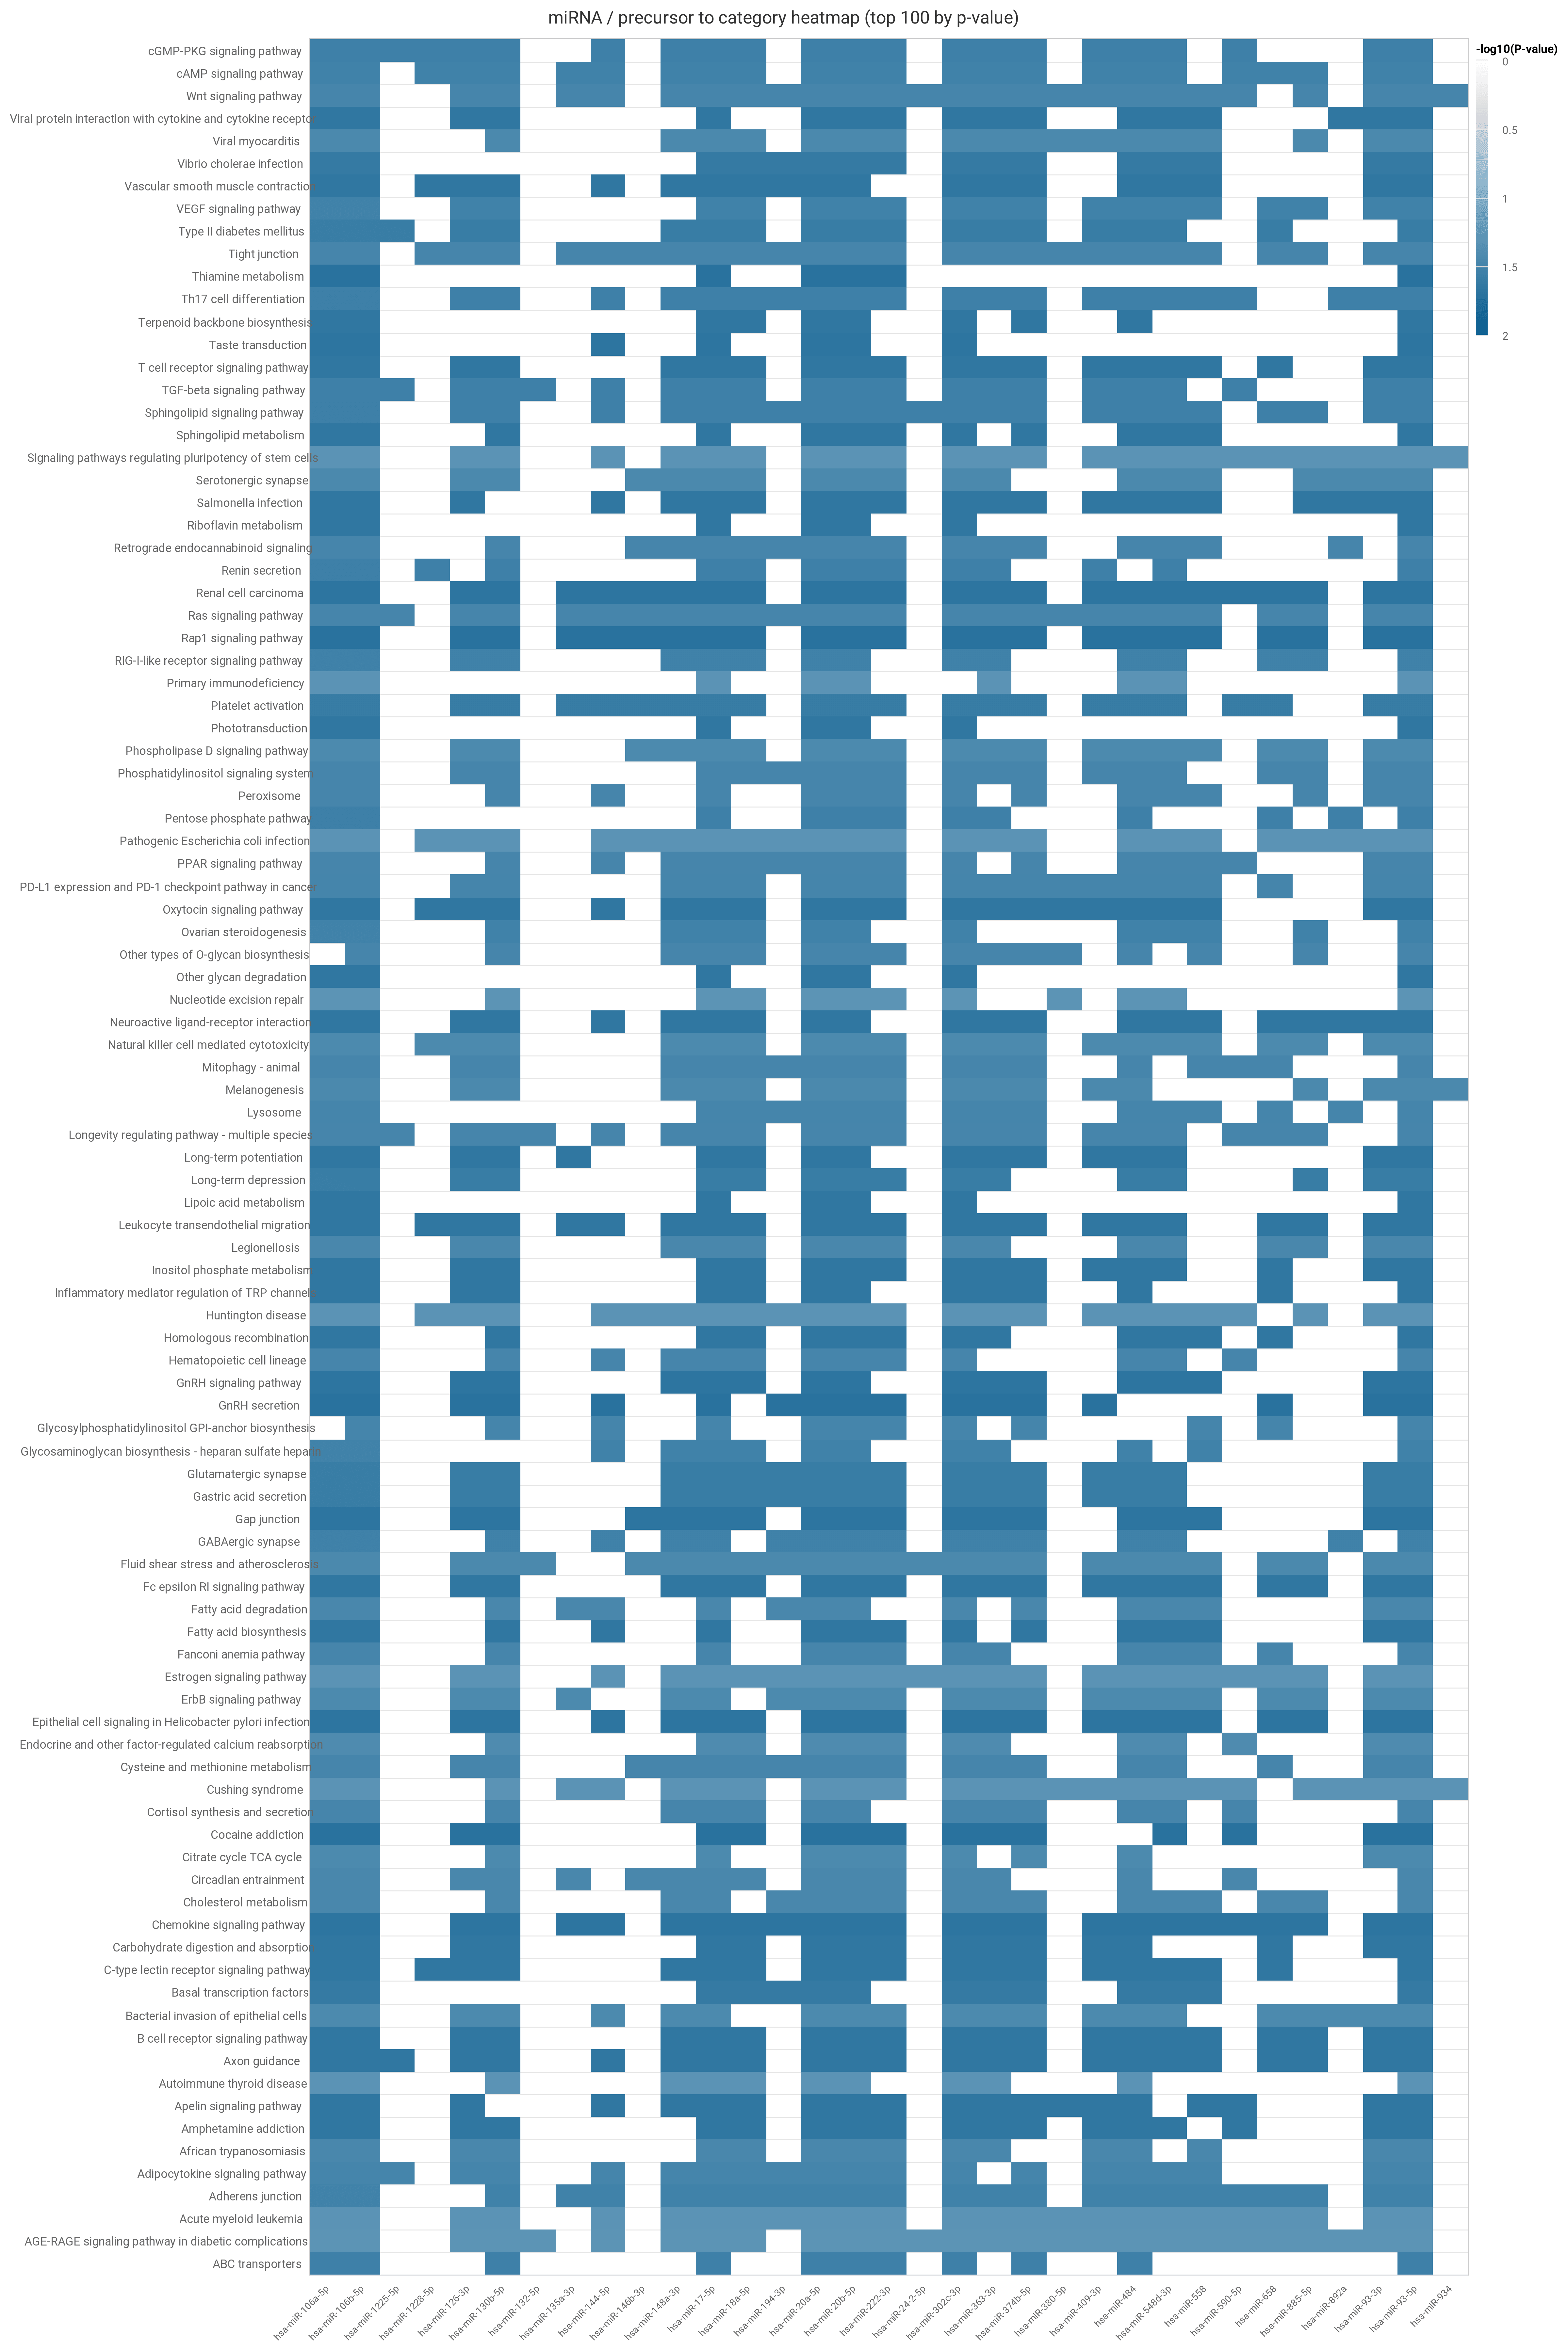
The heatmap displays the -log base 10 p-values of the 100 most significant subcategories as rows, with columns containing the miRNAs/precursors.
Hovering over row labels will display the source category. Both plots can be exported via the arrow link in the upper right corner into common format such as .png, .jpeg, or .pdf.
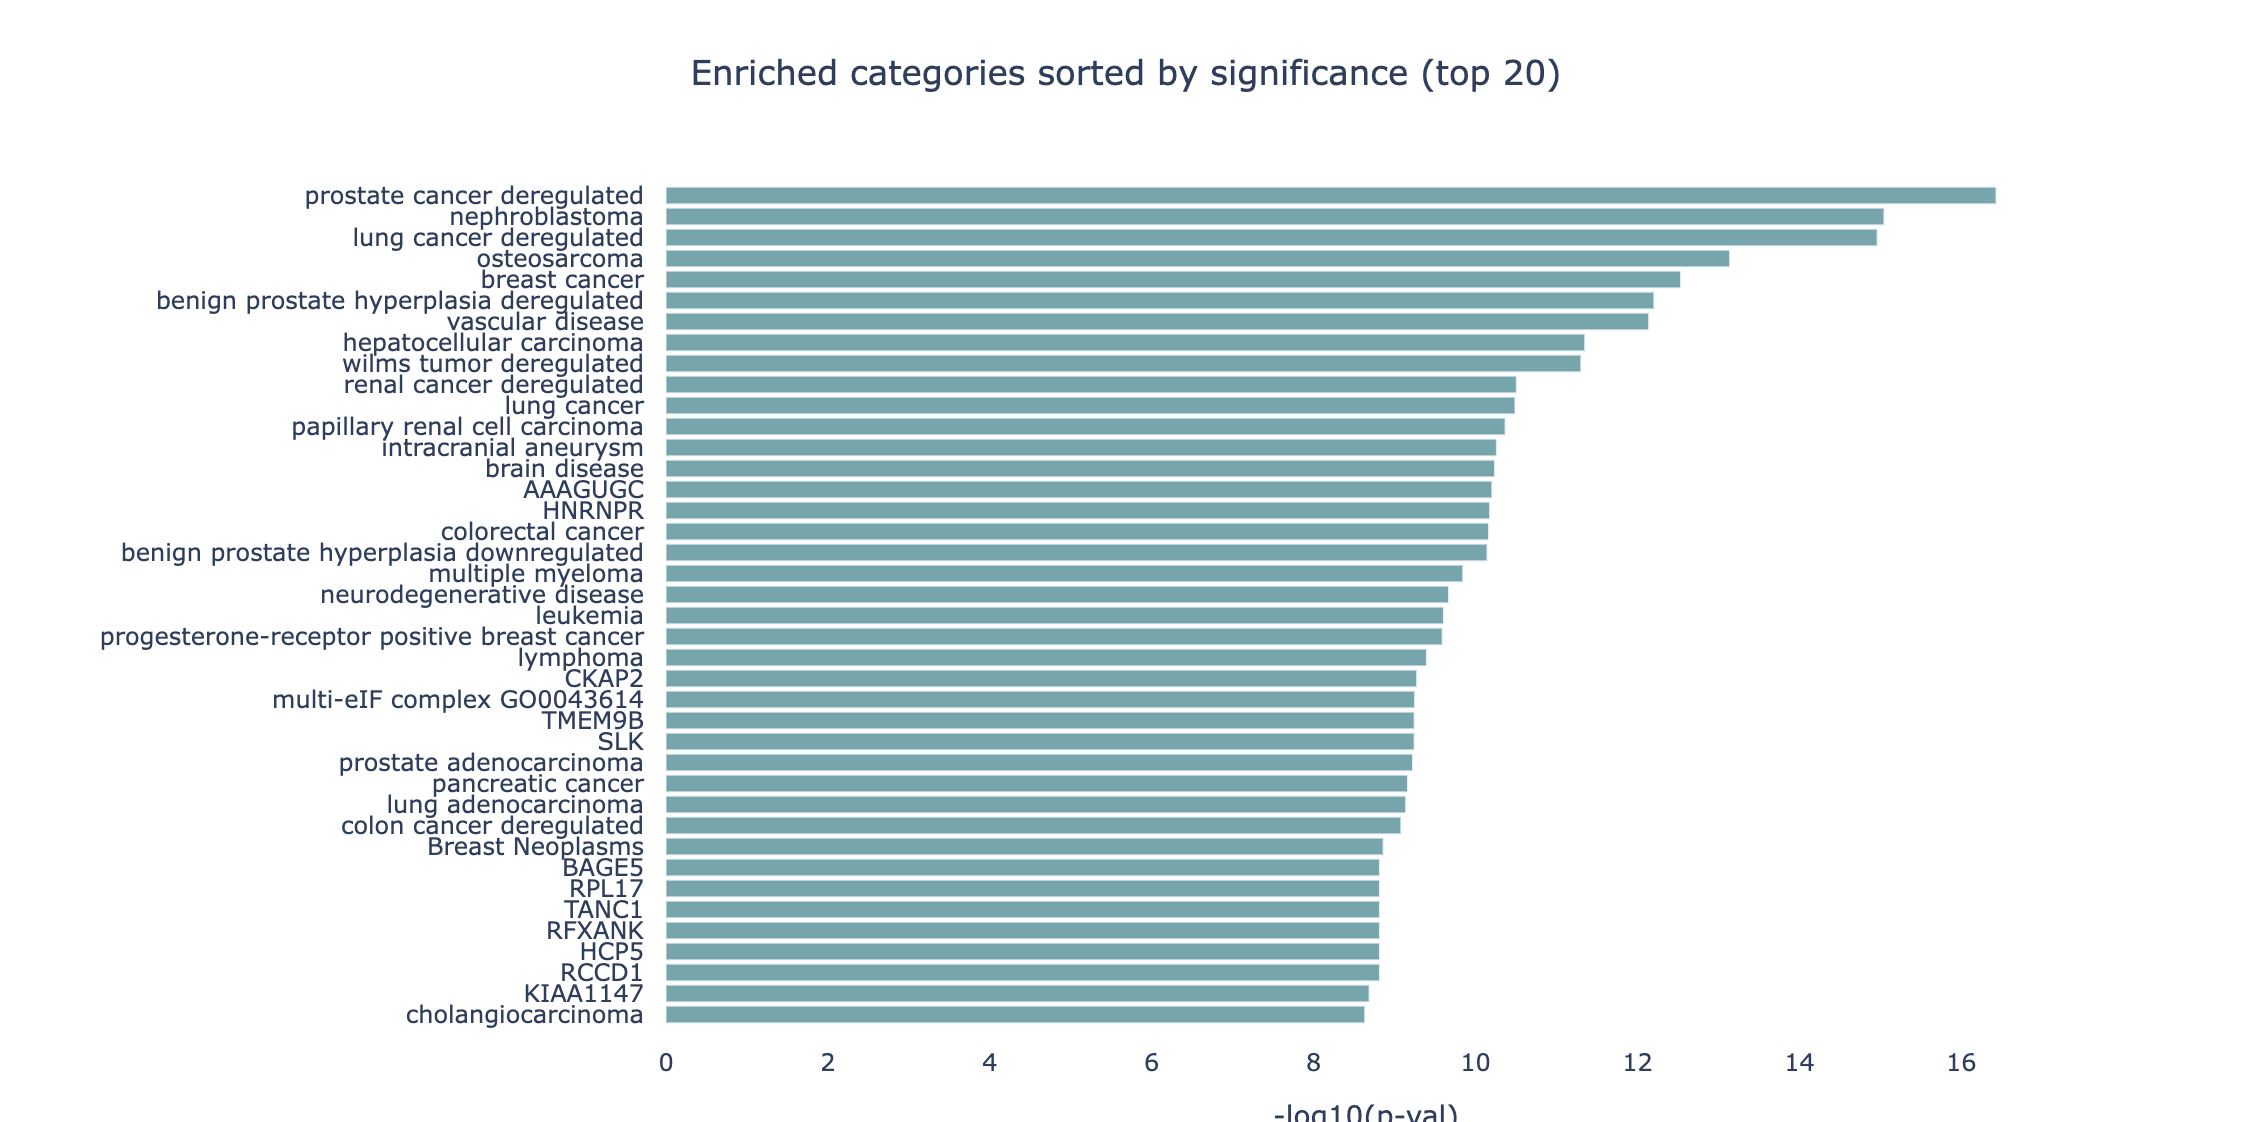
By default, the barchart plot displays the p-values (expressed as -log10) of the 20 most significant results. Different selectors
can be used to switch the sorting and representation to the highest amount of hits and the highest Observed/Expected ratio.
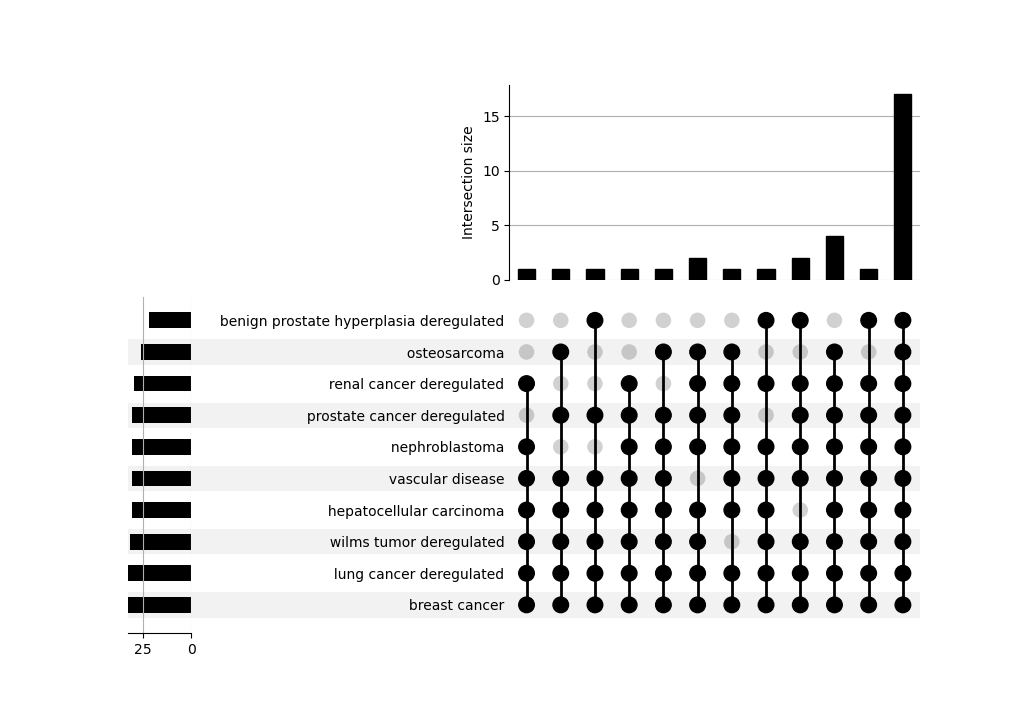
An UpSet plot is also provided to explore how different terms/categories are related to each other by sharing a core of miRNAs.
It can be interpreted as a multi-set Venn Diagram where each bar is the size of an intersection among sets.
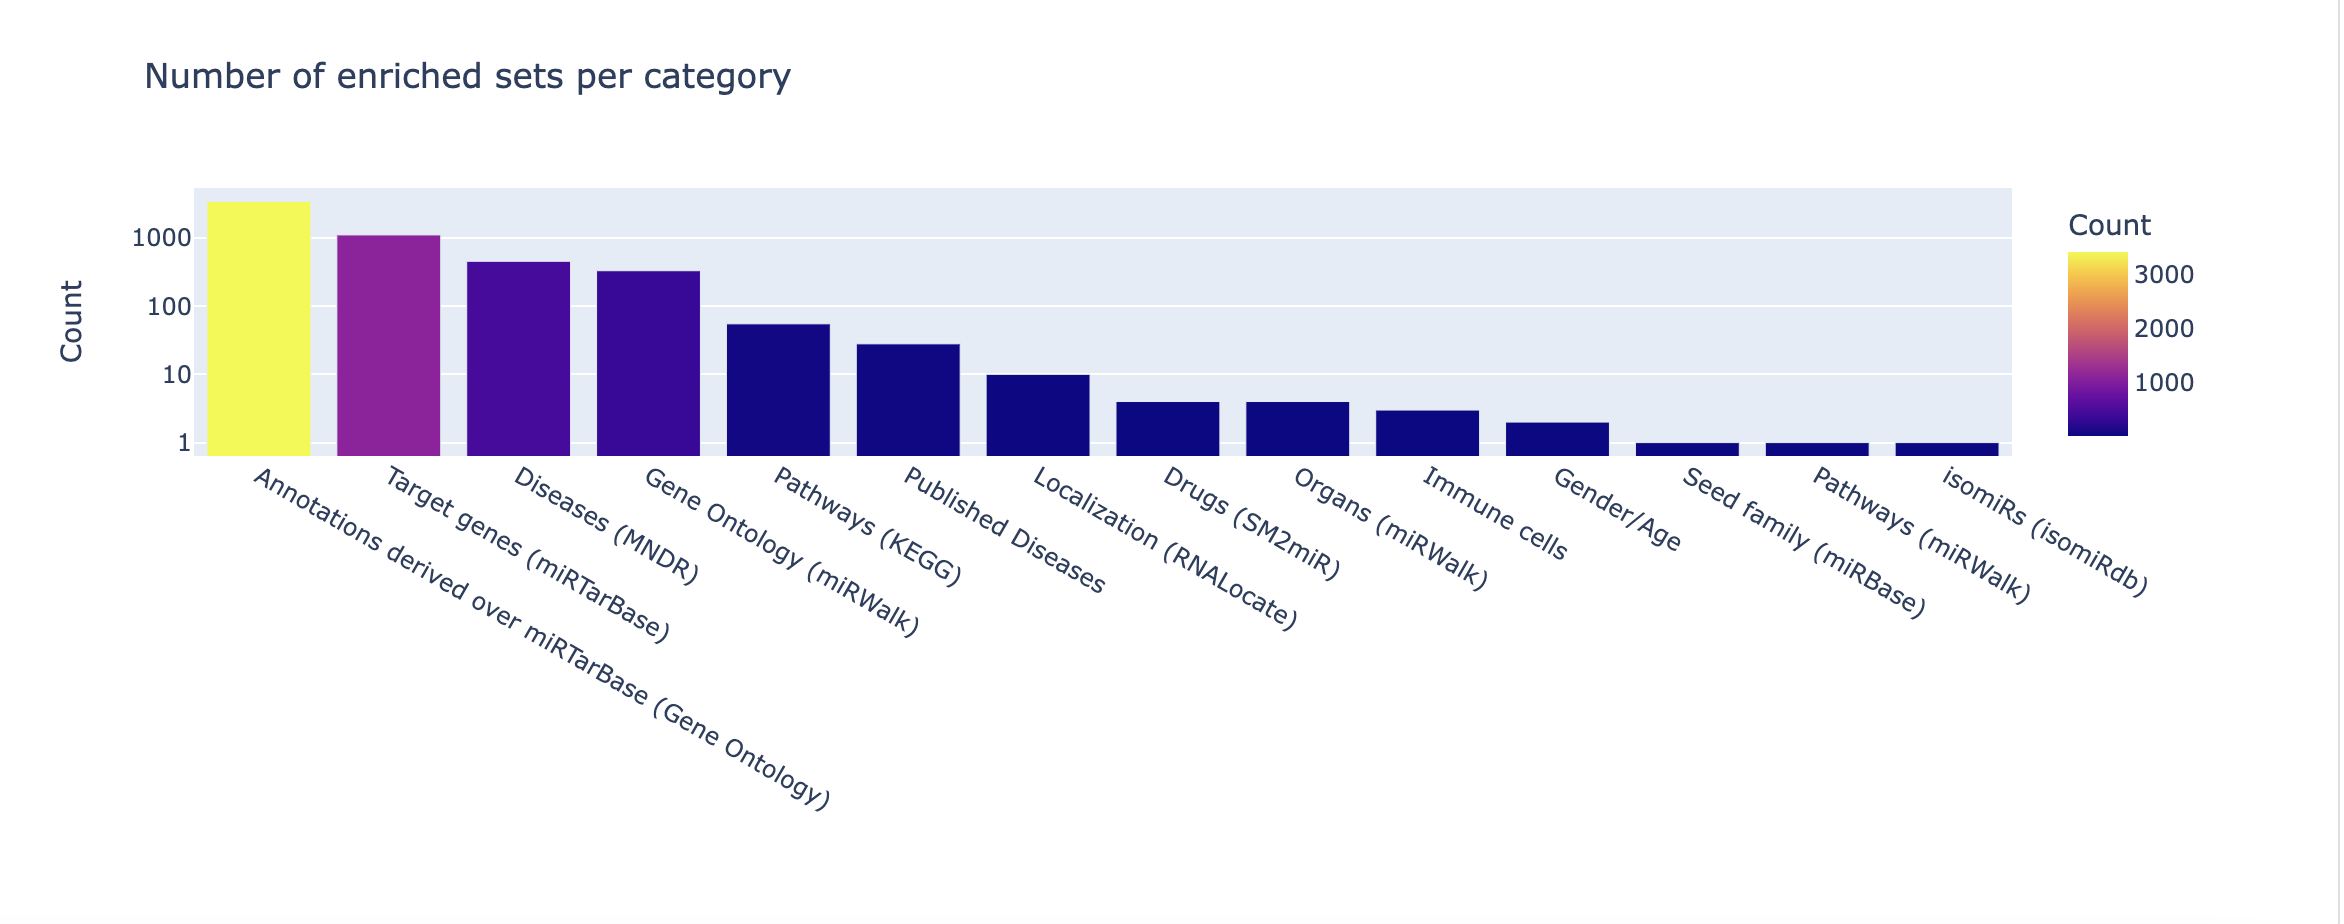
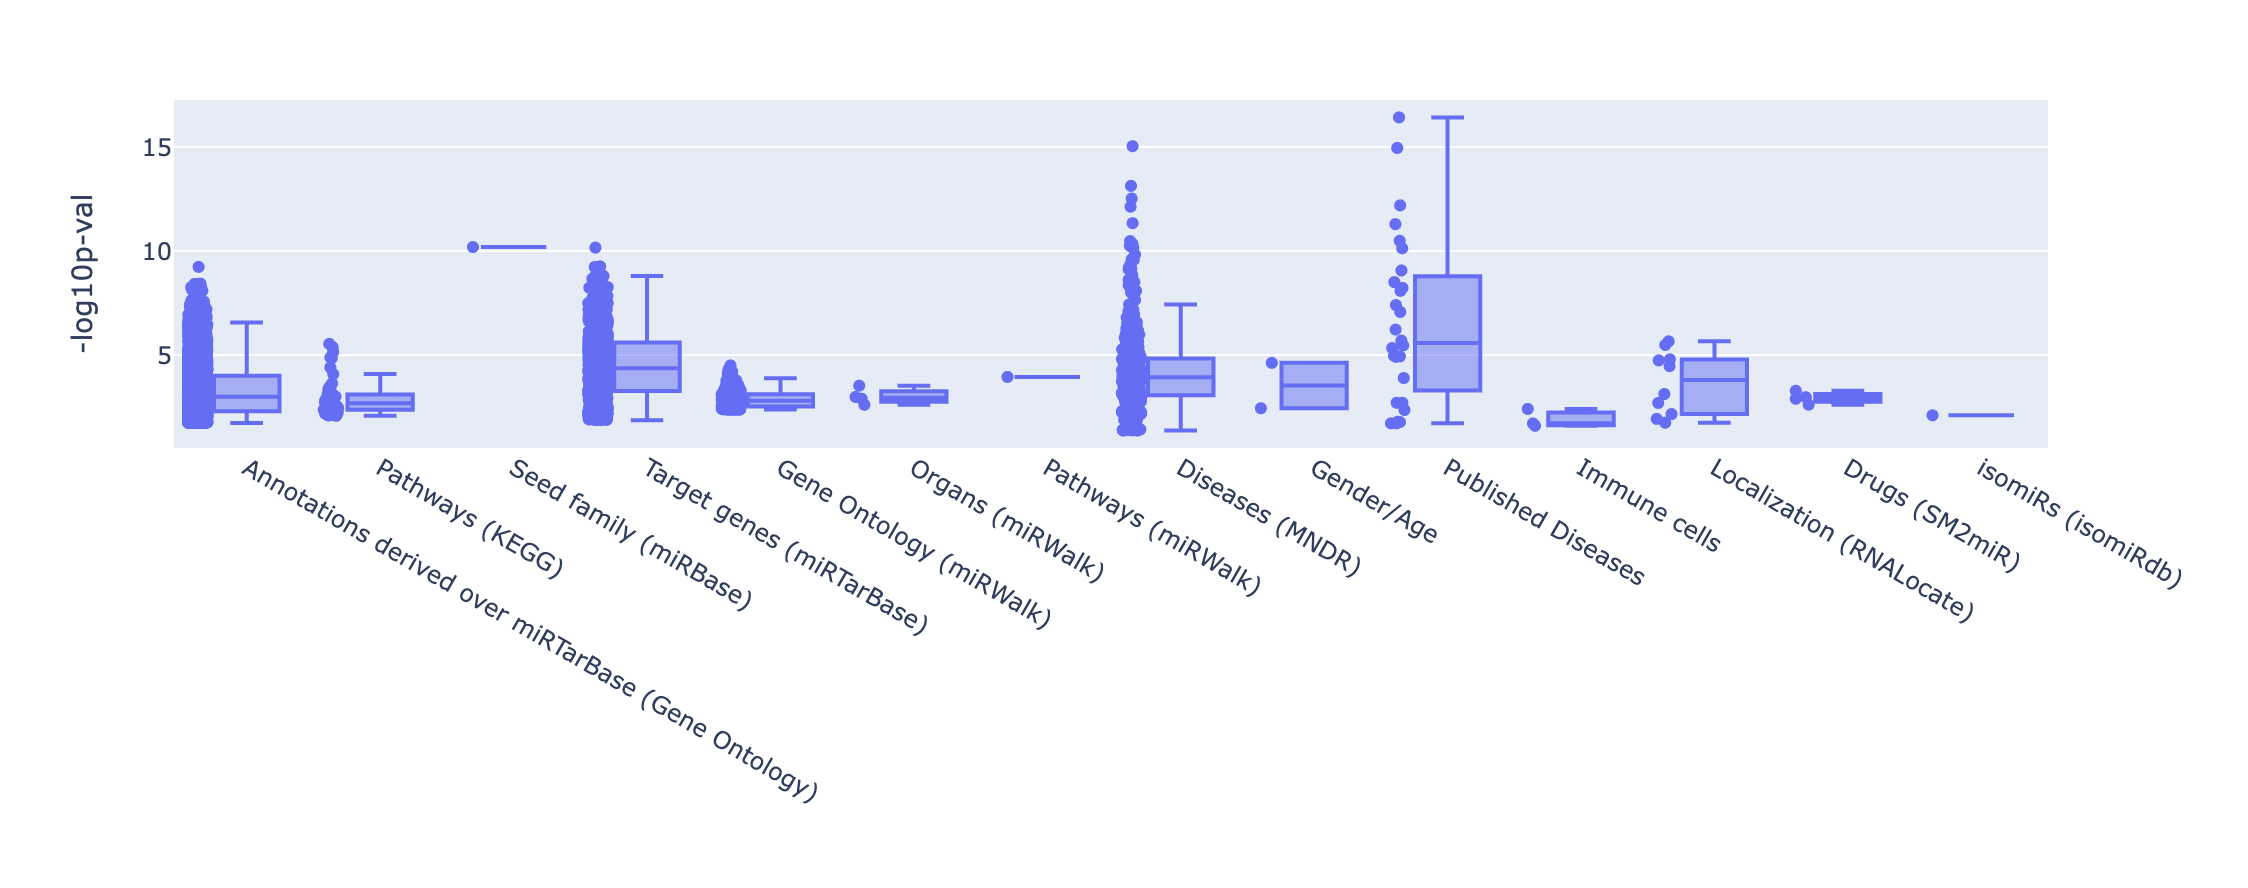
Finally, an overview of the categories and databases present in your significant results can be found in the categories summary and p-values plot.
The summary merely provides counts for each set enriched per category or database. In the p-values plot, -log10 p-values
are represented and grouped by the database of origin and users can choose among different thresholds.